
- Ecology
- Sewage sludge
- May–June 2026
Sewage sludge: half the cadmium after treatment
We treated excess activated sludge cake at a municipal treatment plant and compared accredited laboratory protocols before and after.
- cadmium in sludge
- −50%
- 2.0 → 1.0 mg/kg
- heavy metals on average
- −31%
- across seven metals
- hazard
- Class V
- practically non-hazardous waste — before and after
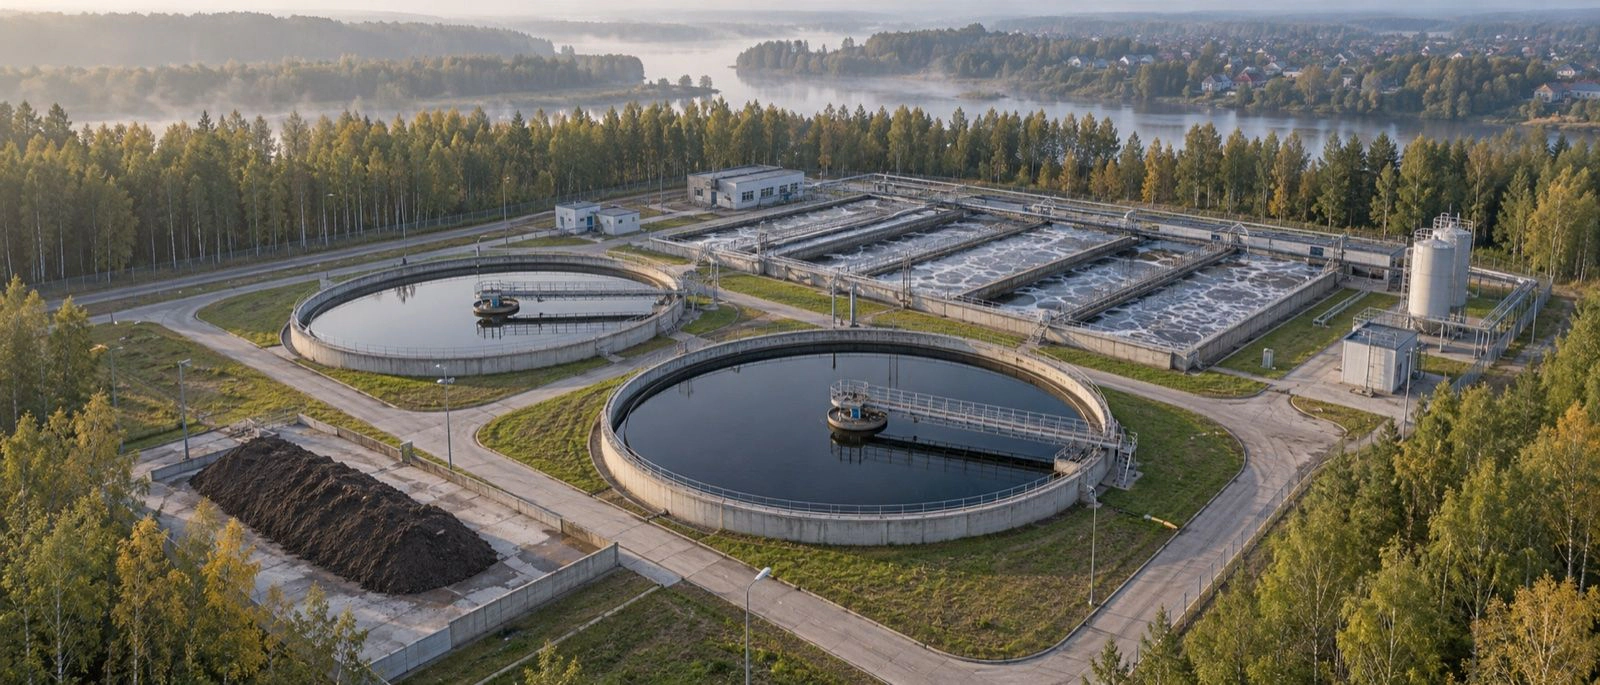
Trial passport
The conditions under which the result was obtained. The full report is in the documents below.
- Subject
- Excess activated sludge cake from biological treatment with mechanical treatment sludge
- Site
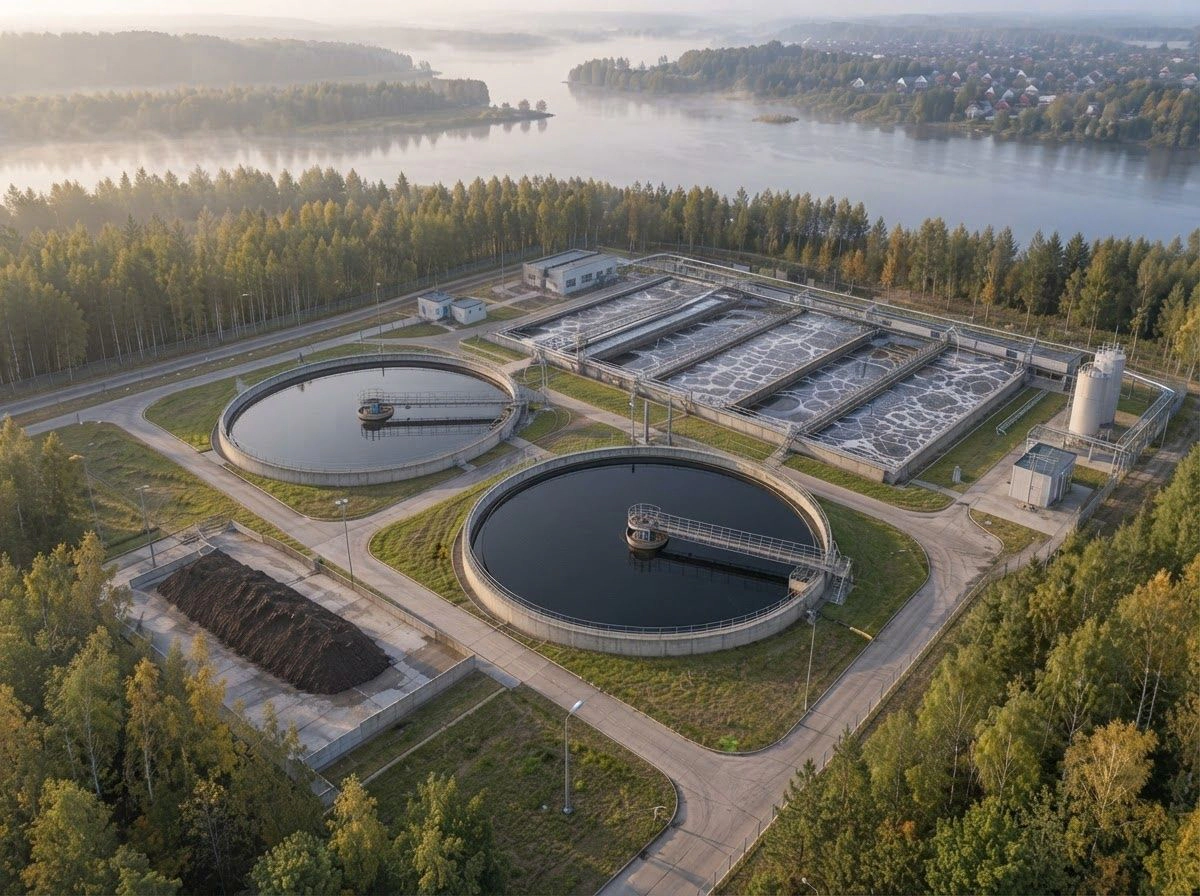
- Municipal treatment plant, Verkhnyaya Salda
- Region
- Sverdlovsk region
- Product
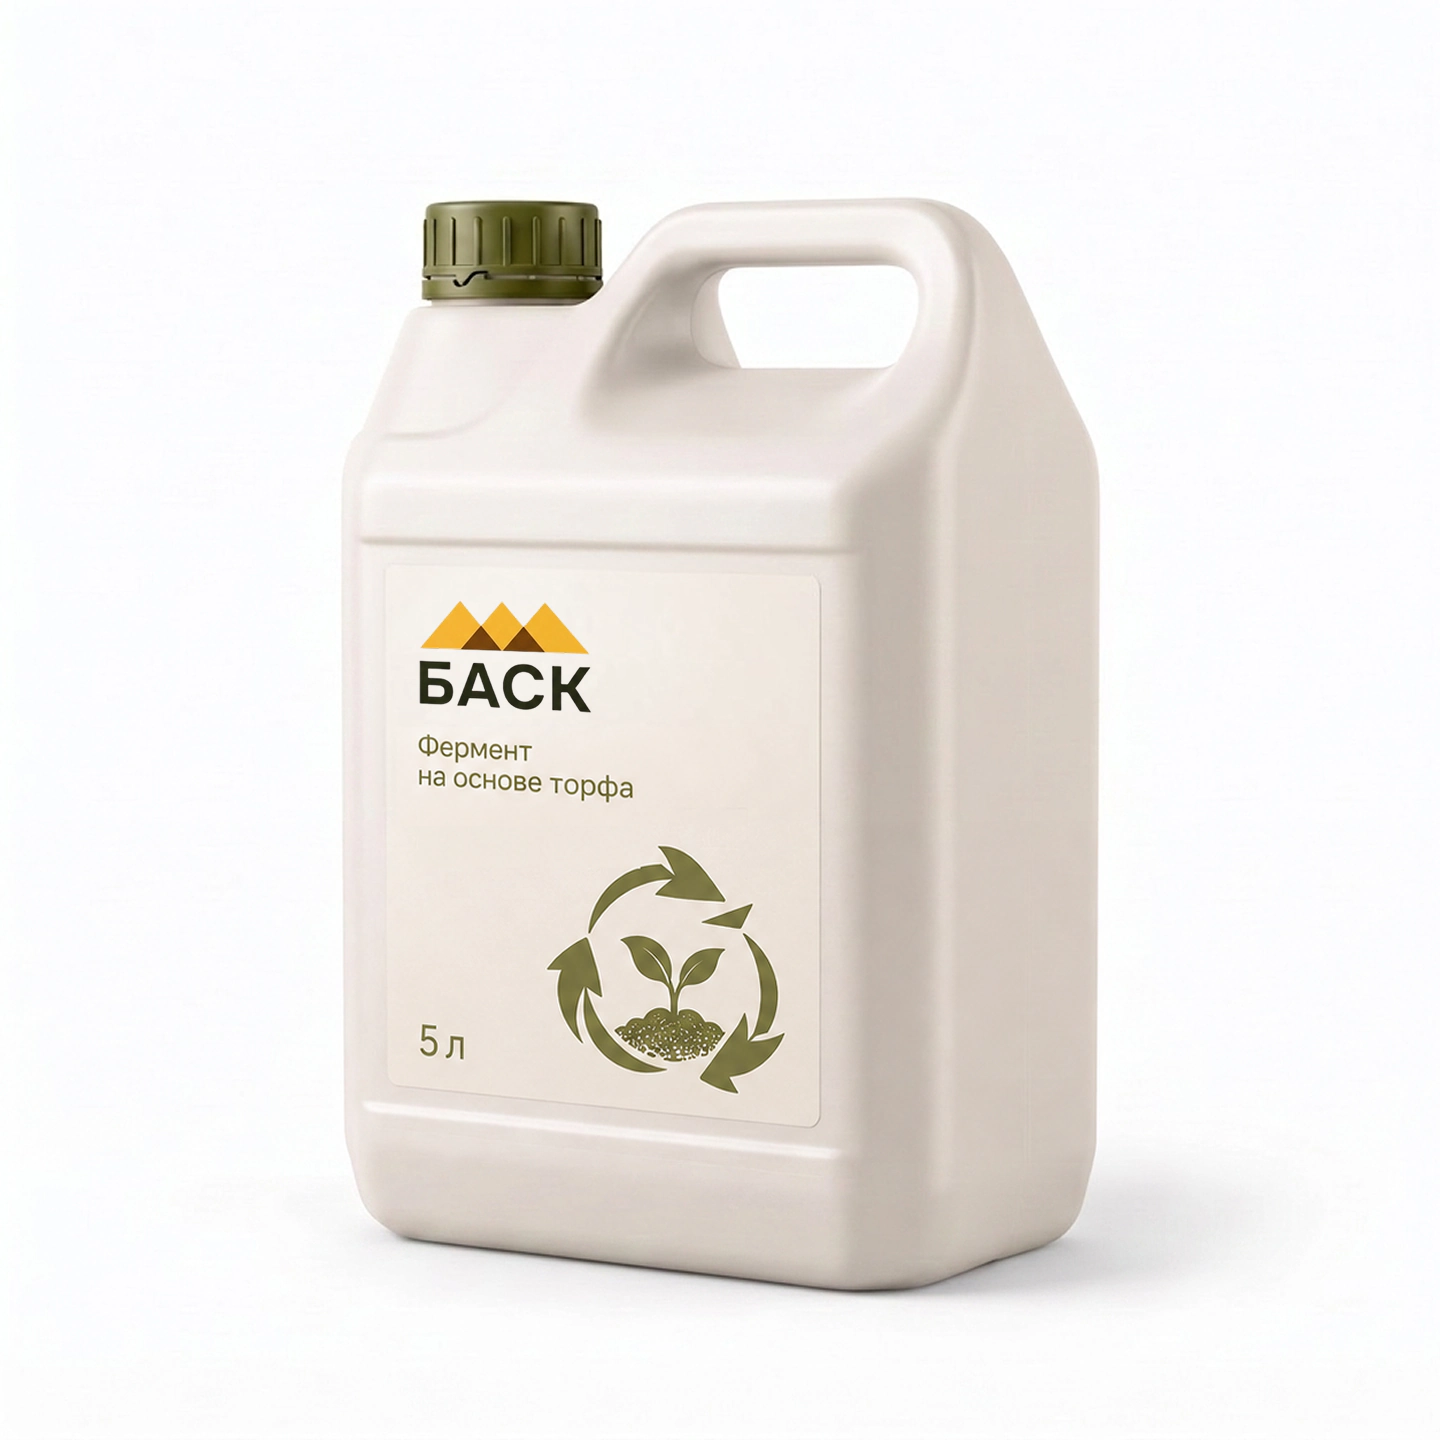
- BASK product, 10 l per 1 m³ of cake
- Period
- Samples on 7 May and 24 June 2026 · 7 weeks
- Before treatment
- Original cake: chemical analysis and biotesting
- After
- Cake after treatment: the same analyses in the same laboratory
- Analyses
- Accredited testing laboratory; conclusion by a researcher of a specialised institute
- Document
- Comparative report
Objective
To reduce the heavy metal content of the sludge and check whether the treated cake can be used as fertiliser.

Heavy metals
Cadmium, copper, chromium, nickel and zinc restrict the use of sludge on land.

Safety
Confirm the waste hazard class by biotesting.

Use as fertiliser
Assess the composition of the cake as an organomineral fertiliser.
How the trial was run
Samples were taken at the same process point before and after treatment — so the results can be compared directly.
Before treatment
- Original excess activated sludge cake
- Chemical analysis — 7 May
- Biotesting — 7 May
After treatment
- Treatment with BASK product, 10 l/m³
- Chemical analysis — 24 June
- Biotesting — 24 June
- 7 May01
Samples before
Sampling and analysis of the original cake in an accredited laboratory.
- May02
Treatment
The cake was treated with BASK product at 10 l per 1 m³.
- 24 June03
Samples after
Repeat chemical analysis and biotesting in the same laboratory.
- 26 June04
Conclusion
Comparison of the protocols and a researcher's conclusion.
Results
We compared sludge analyses before treatment and 7 weeks after. Both analyses were done by the same accredited laboratory.
Metal, mg/kg
| Metal, mg/kg | Before | After | Reduction |
|---|---|---|---|
| Cadmium | 2.0 → 1.0 | 1.0 | −50% |
| Copper | 282 → 176 | 176 | −38% |
| Chromium | 146 → 96 | 96 | −34% |
| Cobalt | 16 → 11 | 11 | −31% |
| Nickel | 139 → 100 | 100 | −28% |
| Zinc | 704 → 511 | 511 | −27% |
| Manganese | 453 → 329 | 329 | −27% |
The bar is the metal content after treatment; the whole scale is the initial level before treatment.
Why it worked
Humic acids bind metals into stable compounds, which become immobile.
- 01
Metals are bound
Humic acids form insoluble complexes with metal ions.
- 02
They do not come back
Bound metals do not return to a mobile form with normal fluctuations in moisture and pH.
- 03
More organic matter
The organic matter content of the cake increased: 43.4% → 44.6%.
- 04
Milder pH
pH shifted from 7.2 to 6.7 — into the slightly acidic range that suits plants.
Conclusions
Cadmium in the sludge halved — from 2.0 to 1.0 mg/kg
Heavy metals −31% on average across seven indicators
The waste kept hazard class V: test organism mortality — 0%
The treated cake can be considered an organomineral fertiliser
A comparison of two pairs of protocols from the same laboratory. Mercury, arsenic and lead did not change. We design a scheme for your site separately.
Other cases
All cases
Let's test the result on your farm
We apply the solution to part of a field, herd or waste volume and compare it with a control. You decide on adoption after the result.
- 01
We discuss the task
We choose the indicators we will compare.
- 02
We set up the trial
A specialist visits you and sets aside trial and control groups — in the field, on the farm or at the site.
- 03
We take measurements
We record the indicators throughout the season or cycle.
- 04
We sum up
We hand over a report and an application scheme for your farm.
What you get
Results in your conditions
On your field, herd or site
A report compared with the control
Figures you can show to management
An application scheme for your farm
Rates, method and frequency of application
Or call us: +7 (343) 287-99-97 · we will agree on terms and timing on the first call