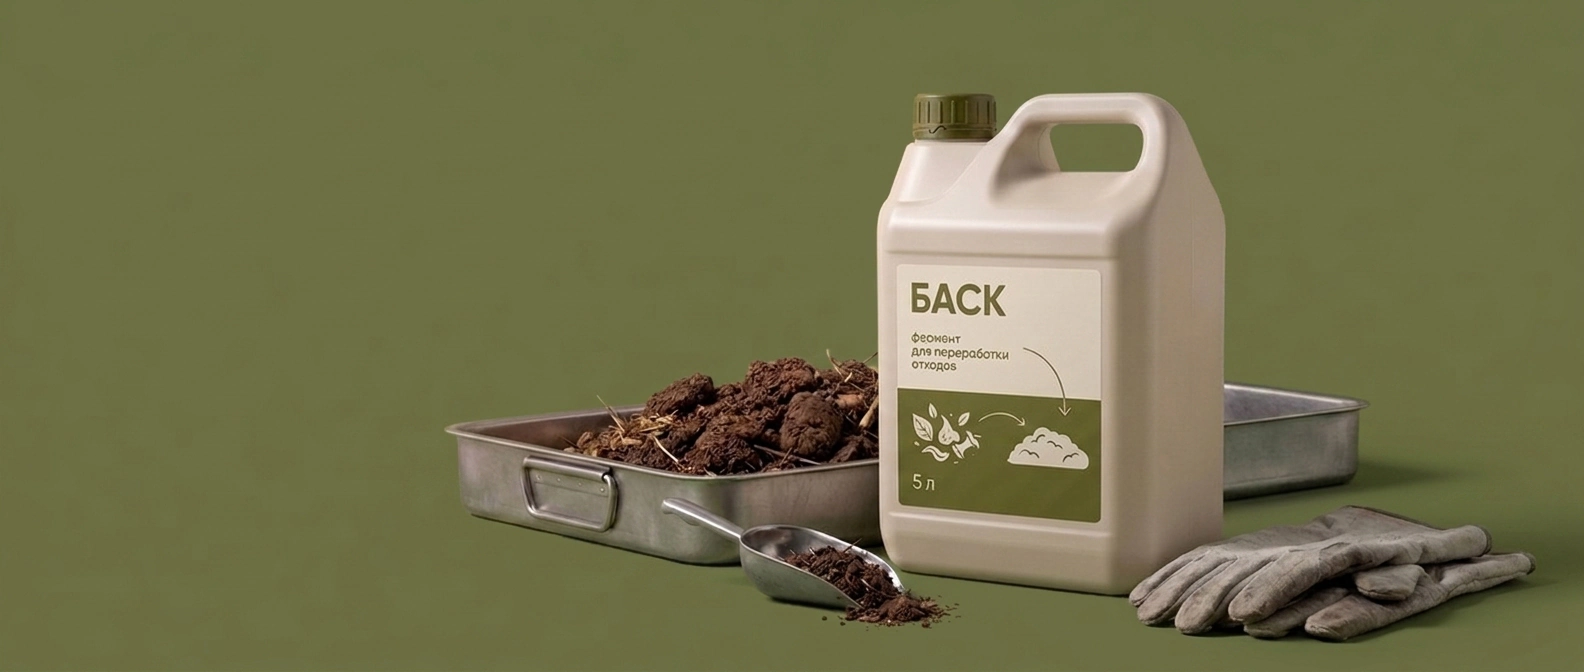
 Own raw materials and production
 Confirmed by field trials
 Delivery across Russia


Metal, mg/kg
| Metal, mg/kg | Before | After | Reduction |
|---|---|---|---|
| Cadmium | 2.0 → 1.0 | 1.0 | −50% |
| Copper | 282 → 176 | 176 | −38% |
| Chromium | 146 → 96 | 96 | −34% |
| Cobalt | 16 → 11 | 11 | −31% |
| Nickel | 139 → 100 | 100 | −28% |
| Zinc | 704 → 511 | 511 | −27% |
| Manganese | 453 → 329 | 329 | −27% |
The bar is the metal content after treatment; the full scale is the initial level before treatment.
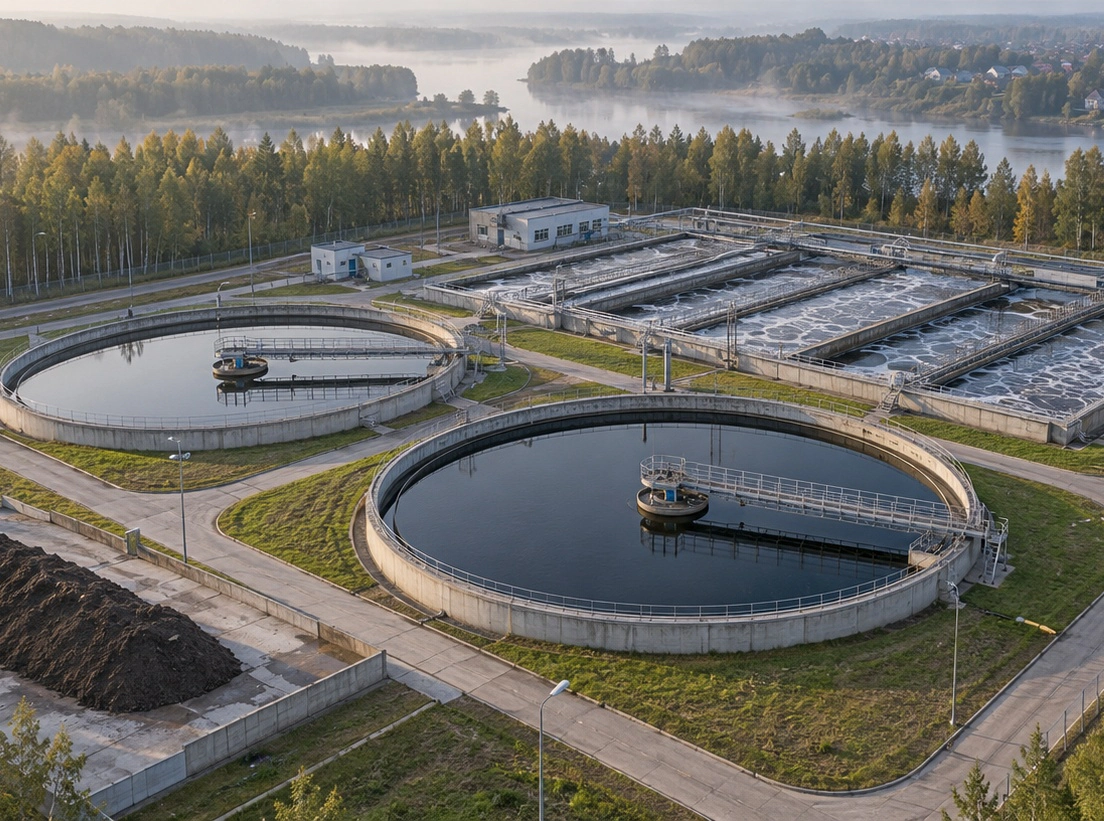
Wastewater treatment plant, Verkhnyaya Salda
Treating excess activated sludge cake
- 7 weeks
- Accredited laboratory
- Before and after reports
−50%
Cadmium
content fell by half
- Metals, avg.
- −31%
- Hazard class
- V
Heavy metals, mg/kg
| Heavy metals, mg/kg | Before | After | Reduction |
|---|---|---|---|
| Cadmium | 2.0 → 1.0 | 1.0 | −50% |
| Copper | 282 → 176 | 176 | −38% |
| Chromium | 146 → 96 | 96 | −34% |
| Cobalt | 16 → 11 | 11 | −31% |
| Nickel | 139 → 100 | 100 | −28% |
| Zinc | 704 → 511 | 511 | −27% |
| Manganese | 453 → 329 | 329 | −27% |
The bar is the metal content after treatment; the full scale is the initial level before treatment.
- Metals, avg.
- −31%
- Hazard class
- V
- Cadmium
- 2× lower
After treatment, heavy metals in the sludge cake fell by 31% on average and cadmium by half. The waste kept hazard class V, so it can be considered an organomineral fertiliser.
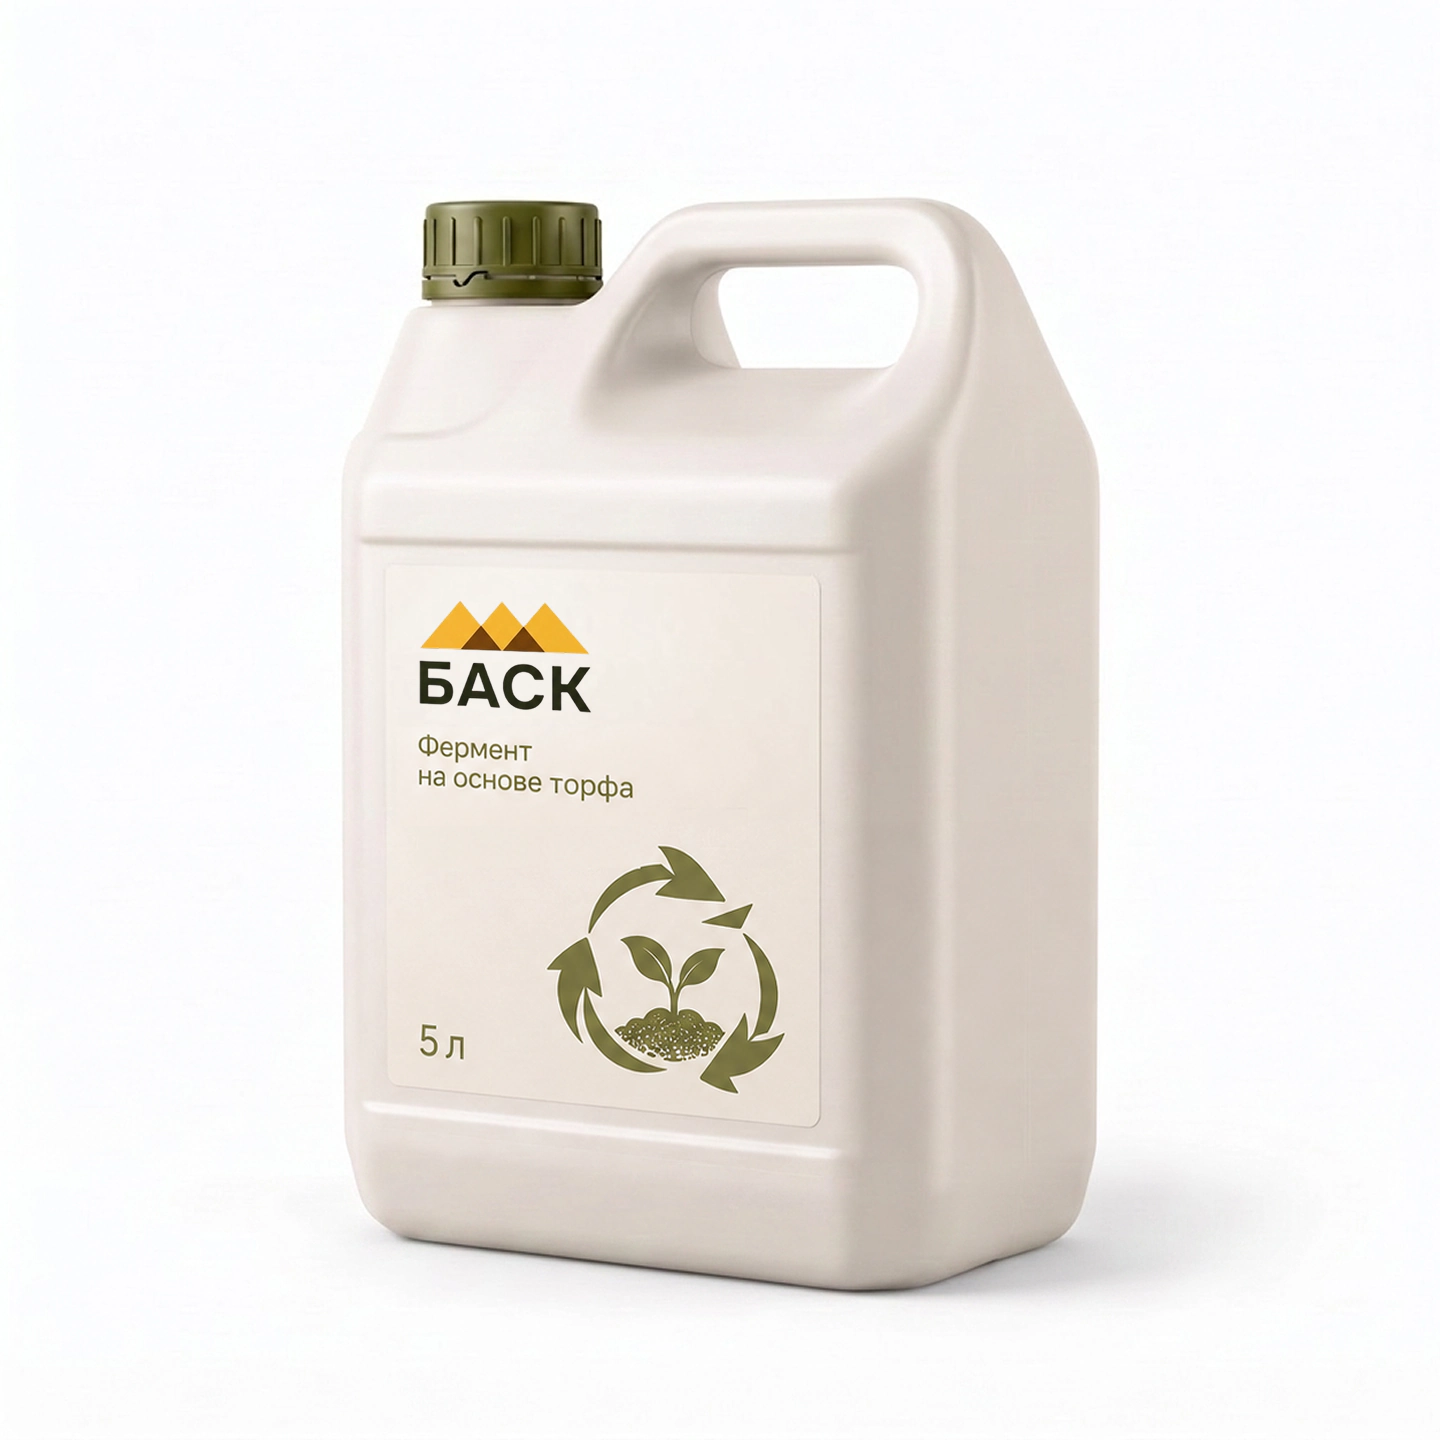
 Organic base — lowland peat
 Chelated (active) form of acids
 Amino acids, minerals, vitamins
 High biological activity